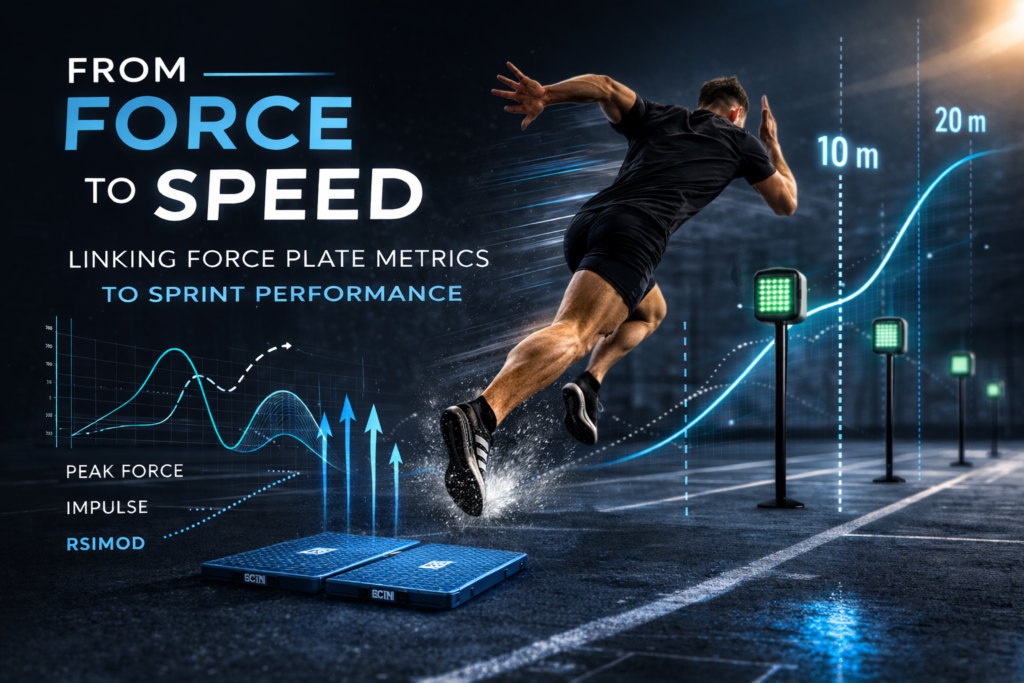
Two athletes run 10m in 2.0 seconds but they look different.
Same time. Different force strategies.
One because they generate a lot of force, the other because they are more reactive and elastic.
If you want to improve acceleration, you need to understand both the outcome (how fast they run) and the mechanism (how they produce force). That is where combining timing gates and force plates becomes powerful.
Why Sprint Time Or Force Plate Data Alone Is Not Enough
The most actionable model is: “timing gates define the problem; force plates suggest the mechanism.”
Sprint time and force plate data each tell an important story, but only half of it. Timing gates show you the outcome: how fast an athlete covered 10 metres. Force plates show you the capacity and strategy: how much force they can produce, how quickly they produce it, and how they apply it. If you rely on sprint time alone, you cannot see whether acceleration is limited by strength, reactivity, or technique. If you rely on force plate data alone, you cannot confirm whether improvements in force production actually transfer to sprint speed. True acceleration profiling happens when outcome and mechanism are measured together.
Which Force Plate Measures Are Important For Sprinters?
Impulse metrics
- What they represent:
How much total “push” the athlete produces during the movement. Impulse combines how hard you push and how long you push for. In jumping, the more effective push you create against the ground, the more upward speed you generate at take-off — which leads to greater jump height.
Importantly, athletes can achieve the same impulse in different ways:
A big force over a short time
A moderate force over a longer time
That’s why looking at impulse helps you understand not just the outcome, but the strategy used to create it.
- Links to sprint splits:
- In professional football players, relative net propulsive impulse during CMJ showed small-to-moderate correlations with sprint time across segments: 0–5 m (r ≈ −0.25), 5–10 m (r ≈ −0.24), and 10–30 m (r ≈ −0.32). In the same study, relative net braking impulse showed smaller correlations.
- How to use it:
- If an athlete has a consistent deficit in multiple segments (0–5, 5–10, 10–30) alongside low propulsive impulse, it supports a “general output” limitation (or suboptimal CMJ strategy) rather than a purely technical start issue.
- If impulse is “good” but early split is poor, the limiting factor may be sprint-specific force orientation/technical effectiveness rather than general impulse capacity (i.e., the athlete can create impulse vertically but may not express it effectively in sprint posture).
Peak force and mean force
- What they represent clinically:
- Maximal instantaneous GRF (peak) and sustained output (mean). Peak force can matter, but sprint performance is rarely determined by peak force alone; how quickly and effectively force is applied often matters more.
- Links to sprint splits:
- In elite Australian rules football athletes, relative CMJ peak force was significantly associated with sprint split times over 5–20 m and with sprint mechanical variables (power and maximum horizontal force derived from sprint profiling).
- However, in highly trained basketball players, CMJ peak force was not correlated with several performance outcomes, highlighting that peak force signatures may be sport-, cohort-, and method-dependent.
- How to use it:
- Peak force can help interpret the 0–10 m profile when paired with time-based metrics (time-to-takeoff, RSImod) and with strength diagnostics (e.g., IMTP) rather than interpreted alone.
RSImod and RSI
- Definitions:
- RSI (reactive strength index): commonly measured in drop jump or rebound tasks as jump height divided by contact time.
- RSImod (modified RSI): commonly defined as CMJ jump height divided by time-to-takeoff (TtT), shifting the emphasis from ground contact to the time constraint of producing the jump.
- Evidence linking to sprint performance:
- A systematic review and meta-analysis in Sports Medicine reported that RSI is moderately associated with sprint acceleration (summary r ≈ −0.43 for <30 m distances) and more weakly-to-moderately associated with top speed measures (summary r ≈ −0.33 for 30–100 m).
- In elite soccer players, CMJ- and IMTP-derived variables explained meaningful variance in linear sprint times (5–20 m), while DJ RSI did not emerge as a dominant linear sprint predictor in that cohort—again suggesting that testing choice and population matter.
- How to use it:
- RSI (drop jump / rebound) is particularly useful when 10–30 m is limiting (where shorter contacts and elastic qualities tend to matter more), and when you want a robust “time-constrained power” signal.
- RSImod is useful when you want to preserve CMJ familiarity while introducing a time constraint that jump height alone misses; reliability varies by metric selection, so use RSImod alongside a small set of high-reliability variables.
- Normative anchors from a large cross-sectional sample of recreationally active people suggest RSI values (DJ and repeated jumps) in the order of ~90–125 cm/s depending on sex and test type; treat these as broad context only (they are not elite benchmarks and were measured via contact mat).
Eccentric braking and deceleration capability
- Why it matters for sprinting:
- Sprinting is not purely propulsive; athletes must manage braking forces and reposition the limb quickly. Biomechanical syntheses of sprint phases emphasise that acceleration involves increasing propulsion while minimising braking, and later phases require efficient braking-to-propulsion transitions and reduced contact times.
- Force-plate proxy:
- CMJ braking-phase variables (eg: braking impulse) can serve as proxies for eccentric capacity and “brake-to-go” skill in a vertical task. CMJ eccentric phase kinetics have also been linked to eccentric strength proxies in squat testing, supporting their use as a practical eccentric assessment tool when direct eccentric testing is impractical.
- How to use it:
- When later sprint segments (5–10, 10–30) are relatively weaker, braking-related deficits are a plausible contributor, particularly when paired with longer time-to-takeoff or poorer RSImod/RSI.
Asymmetry
- What the broader evidence says:
- A systematic review and meta-analysis found that lower-limb inter-limb asymmetries (often measured via unilateral jump tests) show a small but significant association with sprint performance (summary r ≈ 0.20), while showing no meaningful association with bilateral vertical jump performance.
- At the same time, threshold rules such as “>10% is bad” appear unreliable across populations. In young highly trained basketball athletes, the magnitude of asymmetry (grouped as <10%, 10–14.9%, >15%) did not meaningfully influence sprint outcomes, challenging simple thresholds.
- Some sport-specific studies suggest that higher asymmetry in jump kinetics (e.g., single-leg CMJ) may align with poorer sprinting outcomes, but these findings are not universally consistent and are sensitive to how asymmetry is defined and which task is used.
- How to use it:
- Treat asymmetry as a risk/performance hypothesis generator, not a definitive explanation of sprint splits.
- Prefer tracking direction + magnitude over time (which limb is consistently “down,” and is it stable across weeks?) rather than acting on a single-session percentage.
How to Combine Force Plates and Timing Gates in One Session
A practical 15-minute testing battery may include the follow tests:
- Force Plate: CMJ – 3–5 maximal efforts
- Force Plate: Drop Jump (RSI) – 3 trials
- Timing Gate: 10m or 10y Sprint – 3 trials
- Timing Gate: Optional 20m Sprint
- Timing Gate: Optional 5-0-5 or 5-10-5 COD test
This gives you:
- Force capacity
- Reactive ability
- Real-world sprint output
- Braking and re-acceleration capacity
Interpreting Athlete Profiles
Force Plate to Sprint Profile Classification
| Profile Type | Force Plate Pattern | Sprint Pattern | Training Focus |
|---|---|---|---|
| Strength Deficit | Low impulse, low relative force | Slow 0–10 m | Max strength, heavy sleds |
| Reactive Deficit | High impulse, low RSImod | Decent 10 m, limited progression | Plyometrics, fast SSC work |
| Sprint Performance Transfer Deficit | Improved CMJ, no sprint improvement | Flat sprint times | Technical acceleration work |
| Reactive-Dominant Profile | High RSI, moderate to high impulse | Strong max velocity | Maintain strength base |
Programming Based Off Data
Profile A: Start-limited (0–5 m slow), but decent 10–30 m.
- Likely interpretation: start mechanics and early acceleration force application are limiting more than reactive qualities.
- Force-plate pattern you might see: reasonable RSImod/RSI but lower propulsive impulse and/or lower relative peak force, or a strategy with long time-to-takeoff.
- Prescription emphasis: heavy strength exposure (if strength-limited), resisted acceleration, and start technique—then reassess 0–5 and 5–10. DSI-guided heavy-loading programming improved early sprint metrics in an elite basketball RCT subgroup, supporting the plausibility of the “strength-first” route when appropriate.
Profile B: Transition-limited (5–10 m disproportionately weak).
- Likely interpretation: difficulty maintaining efficient braking-to-propulsion as posture rises; possible eccentric/braking limitation.
- Force-plate pattern you might see: lower braking RFD and/or longer braking duration; propulsive power present but delayed.
- Prescription emphasis: eccentric and “brake-to-go” development (e.g., targeted eccentric strength and plyometric progressions) plus sprint drills that reinforce projection and transition. CMJ eccentric measures can be used as practical eccentric indicators where full eccentric testing is impractical.
Profile C: Speed-development-limited (10–30 m weak), 0–5 m acceptable
- Likely interpretation: time-constrained elastic qualities and step mechanics are limiting more than initial output.
- Useful signals: RSI (drop jump/rebound) and RSImod (CMJ) because they incorporate the time constraint; meta-analysis supports moderate association between RSI and acceleration and a smaller (but significant) association with top speed outcomes.
- Prescription emphasis: reactive strength work (appropriately progressed), exposure to higher-velocity sprinting where relevant, and monitoring of RSI/RSImod alongside 10–30 m splits for responsiveness.
Practical Takeaway
"Timing gates tell you how fast an athlete is. Force plates tell you why."
On their own, each tool leaves blind spots. Timing gates can show improvement, stagnation, or regression but they cannot explain whether the limiting factor is strength, reactivity, or technical execution.
Force plates can show changes in impulse, relative force, or RSI but they cannot confirm whether those changes actually transfer to sprint speed.
When combined, they create a sprint profiling system that:
- Identifies force deficits limiting acceleration
- Differentiates between strength-dominant and elastic-dominant strategies
- Guides targeted programming decisions
- Confirms whether gym improvements transfer to the track or field
- Reduces guesswork in training progressions
For performance coaches working with field and court athletes, integrating CMJ, RSI and 10m sprint testing creates a practical bridge between weight room outputs and on-field performance. Instead of assuming that more strength equals more speed, or that better jump numbers automatically improve acceleration, you can track the full pathway:
Force capacity → force strategy → sprint outcome.
Over time, this approach allows you to individualize training, monitor adaptation, and adjust emphasis with clarity rather than intuition.
Take It Further with AxIT
Strength By Numbers’ AxIT system integrates force plates and timing gates into one connected platform, allowing you to capture CMJ impulse, RSImod, drop jump RSI, relative force, 10m sprint splits and more all in a single workflow.
Instead of juggling separate systems and spreadsheets, AxIT keeps testing data centralized, automatically stored, and easy to interpret over time. You can track athlete profiles, monitor adaptation across blocks, and see clearly whether improvements in force production are transferring to sprint performance.
If you’re serious about building a complete acceleration profiling system not just collecting numbers AxIT provides the tools to measure the mechanism, validate the outcome, and manage the data in one performance platform.
References
- Banyard, H. G., Nosaka, K., & Haff, G. G. (2024). Agreement of clinical-grade and laboratory-grade force plates for countermovement jump metrics in youth athletes. International Journal of Sports Physical Therapy. https://doi.org/10.26603/001c.147057
- Bishop, C., Read, P., Chavda, S., & Turner, A. (2021). Reactive strength index and its associations with measures of physical performance: A systematic review and meta-analysis. Sports Medicine, 51, 1081–1104. https://doi.org/10.1007/s40279-021-01566-y
- Journal of Clinical Medicine. (2024). Force-time characteristics and sprint performance associations. Journal of Clinical Medicine, 13(15), Article 4581. https://doi.org/10.3390/jcm13154581
- European Journal of Applied Physiology. (2024). Mechanical determinants of sprint acceleration and performance profiling. European Journal of Applied Physiology. https://doi.org/10.1007/s00421-024-05470-x
- Journal of Sports Science & Medicine. (2024). Dynamic strength index-guided training and sprint performance outcomes. Journal of Sports Science & Medicine, 23, 504–512. https://doi.org/10.52082/jssm.2024.504
- PLOS ONE. (2023). Lower-limb asymmetry and sprint performance: A systematic review and meta-analysis. PLOS ONE, 18(6), e0286942. https://doi.org/10.1371/journal.pone.0286942
- Applied Sciences. (2025). Force-velocity profiling and performance associations in trained athletes. Applied Sciences, 15(1), 434. https://www.mdpi.com/2076-3417/15/1/434
- Sensors. (2022). Validation of wearable and force plate technologies for jump assessment. Sensors, 22(22), 8610. https://www.mdpi.com/1424-8220/22/22/8610
- Sensors. (2024). Advances in sprint performance monitoring technologies. Sensors, 24(9), 2894. https://www.mdpi.com/1424-8220/24/9/2894